Solar Panel Installer Runcorn, an independent guide › Homes
Runcorn in numbers
The figures behind this guide, from official sources read on 3 November 2026. Where official tables cover Halton or a constituency rather than Runcorn alone, we say so.
Checked against its sources on 3 November 2026. Published by SEO Dons; we do not supply or install solar.
Households, 2021
| Measure | Share of households |
|---|---|
| Terraced house | 35.9% |
| Semi-detached house | 33.5% |
| Detached house | 18.2% |
| Flat, maisonette or apartment | 12.2% |
| Owned outright | 28.3% |
| Owned with a mortgage, loan or shared ownership | 28.5% |
| Social rented | 28.6% |
| Private rented or rent free | 14.6% |
ONS characteristics of built-up areas, Census 2021 (Runcorn, E63001481). 18.5% of residents were 65 or over.
When the homes were built
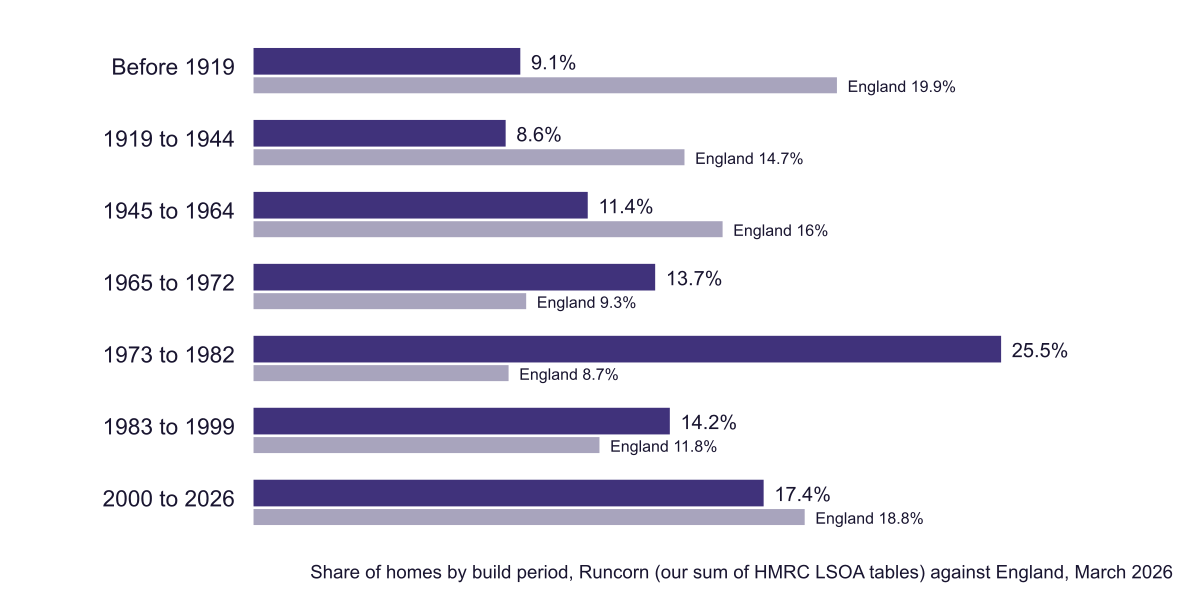
Our sum of the council tax tables for Runcorn's 43 small areas gives about 30,500 dwellings, 39.2% built between 1965 and 1982 (13.7% in 1965 to 1972 and 25.5% in 1973 to 1982), against 18% across England and 22.4% in Widnes. Only 9.1% predate 1919. Bungalows are 11% of the town's homes and terraced houses 36.2%.
Energy ratings
ONS publishes energy ratings by constituency, not by town. In Runcorn and Helsby, 57.26% of homes with an EPC are rated C or better, against 53.28% for England, with a median score of 70 (England 69). Homes built 1930 to 1982: 49.94%; before 1929: 16.68%.
Solar so far
DESNZ counted 2,733 solar installations in Halton at the end of 2025, with 13.59 MW of capacity, up from 2,260 a year earlier, a rise of 20.9%. By September 2026 its constituency tables showed 2,489 home installations (10.05 MW) in Runcorn and Helsby, a seat that also includes Frodsham and Helsby.
Sun across the town
| Point | kWh per kW |
|---|---|
| Castlefields | 946 |
| Palace Fields | 946 |
| Halton Lea | 946 |
| Windmill Hill | 946 |
| Murdishaw | 946 |
| Old Town | 943 |
| Sandymoor | 942 |
| Weston | 942 |
PVGIS 5.3, 14% losses, read 3 November 2026; approximate district centres. The nearest Met Office climate station, Hawarden Airport, records about 1,573 hours of sunshine a year (1991–2020).
Runcorn beside Widnes
Halton's two towns sit either side of the Mersey under one council and one network operator, but their homes differ. Set side by side on the same official measures:
| Measure | Runcorn | Widnes |
|---|---|---|
| Homes built 1965 to 1982 (council tax records, our sums) | 39.2% | 22.4% |
| Households in a terrace (Census 2021, built-up area) | 35.9% | 32.6% |
| Households renting from a social landlord | 28.6% | 21.3% |
| Homes rated EPC C or above (constituency, to March 2025) | 57.26% | 60.78% |
| Domestic solar installations (constituency, September 2026) | 2,489 | 2,143 |
ONS Census 2021 built-up area tables; VOA council tax stock of properties, March 2026, summed by small area; ONS energy efficiency of housing; DESNZ solar deployment. The constituencies are Runcorn and Helsby, which includes Frodsham and Helsby, and Widnes and Halewood, which includes Halewood.
The New Town shows in the first row: Runcorn has nearly twice Widnes's share of homes from the years 1965 to 1982. Runcorn also has more social renting, which puts more of its roofs in landlords' hands, and a slightly lower share of homes rated C or above. The two constituencies have similar numbers of homes with panels so far.
House prices
Land Registry figures are for Halton: an average of £189,435 in August 2026, -2.3% on a year; terraced houses £156,208, semis £200,821.
Keep reading
Where the figures come from
- ONS: characteristics of built-up areas, Census 2021 (Runcorn)
- ONS Census 2021 API: Runcorn wards, accommodation, tenure and age
- Parliamentary Constituencies Order 2023, schedules (Runcorn and Helsby wards)
- HMRC statistics: Council Tax stock of properties, 2026
- ONS: energy efficiency of housing in England and Wales, 2025
- DESNZ statistics: renewable electricity by local authority
- DESNZ statistics: solar photovoltaics deployment (constituency tables)
- HM Land Registry: UK House Price Index, Halton, August 2026
- EU JRC PVGIS 5.3: solar output by location, tilt and direction
- Met Office: Hawarden Airport climate averages 1991–2020
Questions about the figures
How many homes in Runcorn have solar panels?
DESNZ counted 2,489 home solar installations (10.05 MW) in the Runcorn and Helsby constituency by September 2026; the seat also takes in Frodsham and Helsby. Halton as a whole had 2,733 solar installations of all kinds at the end of 2025.
How many people live in Runcorn?
61,645 in the Runcorn built-up area at the 2021 Census, in 28,355 households.
What is the average house price in Runcorn?
HM Land Registry publishes prices for Halton as a whole: £189,435 in August 2026, -2.3% on a year. Terraced houses averaged £156,208.
A flat roof, a quote, or a question about your Runcorn home?
Tell us about the roof or the quote, with your Runcorn postcode. Your message goes to SEO-DONS LTD, the company behind this independent guide, and the reply comes by email. Asking is free and commits you to nothing.
What happens next
- Fill in the form; your postcode tells us which part of Runcorn you are in.
- We look at what you sent and reply by email with the figures and sources that fit.
- Whether you go ahead, and with which firm, is up to you.